Hey, It’s The Future. Data Strategy Is Calling.

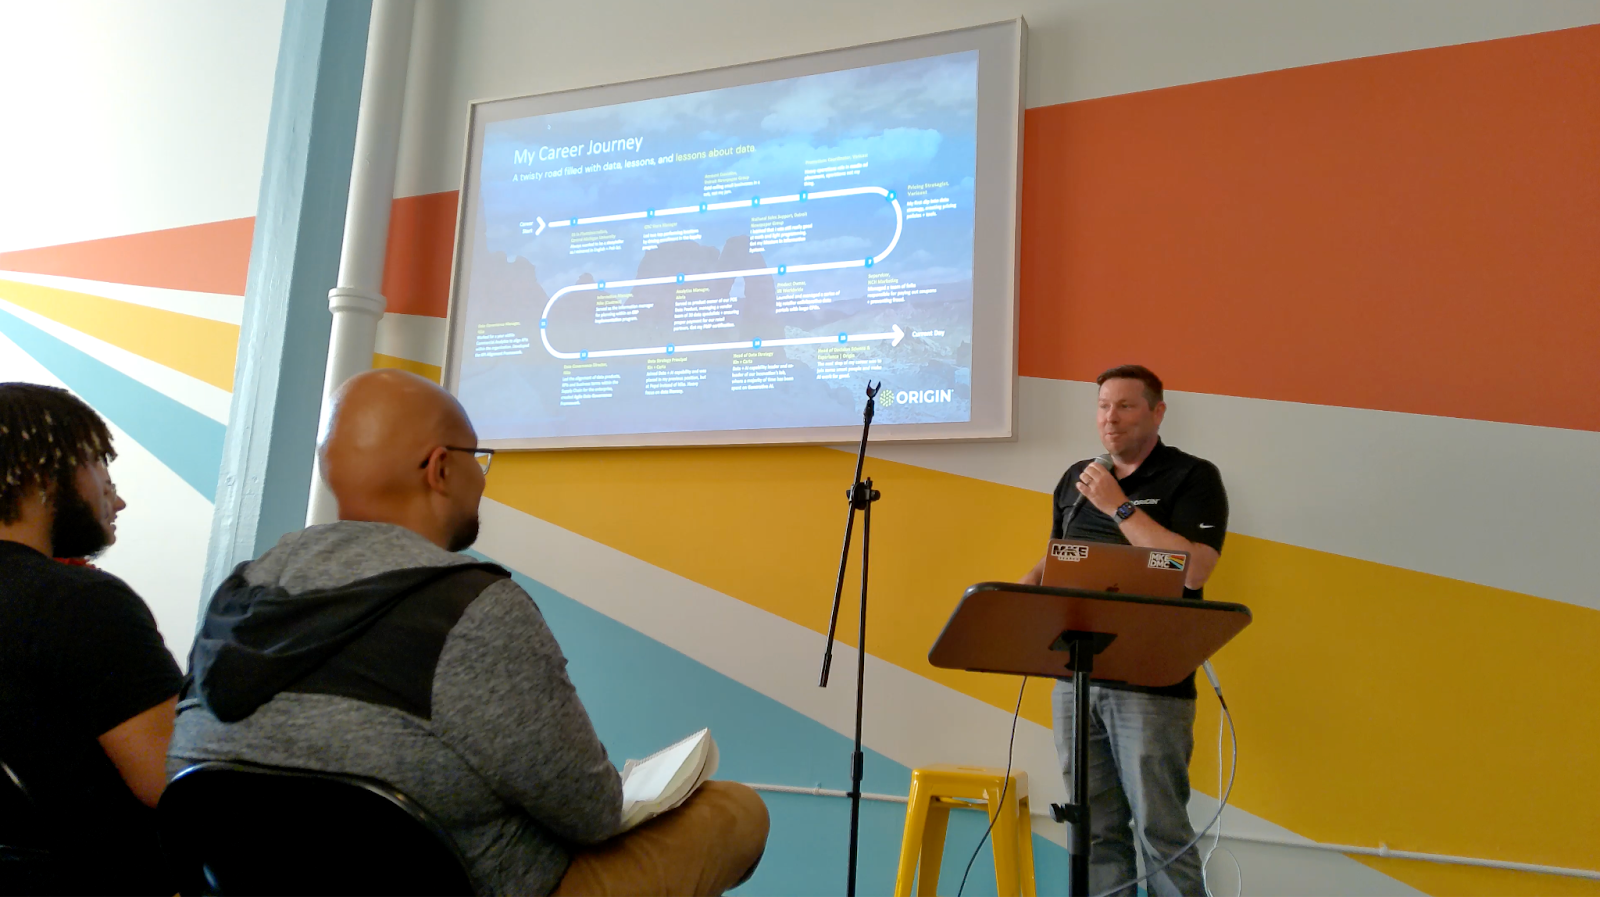
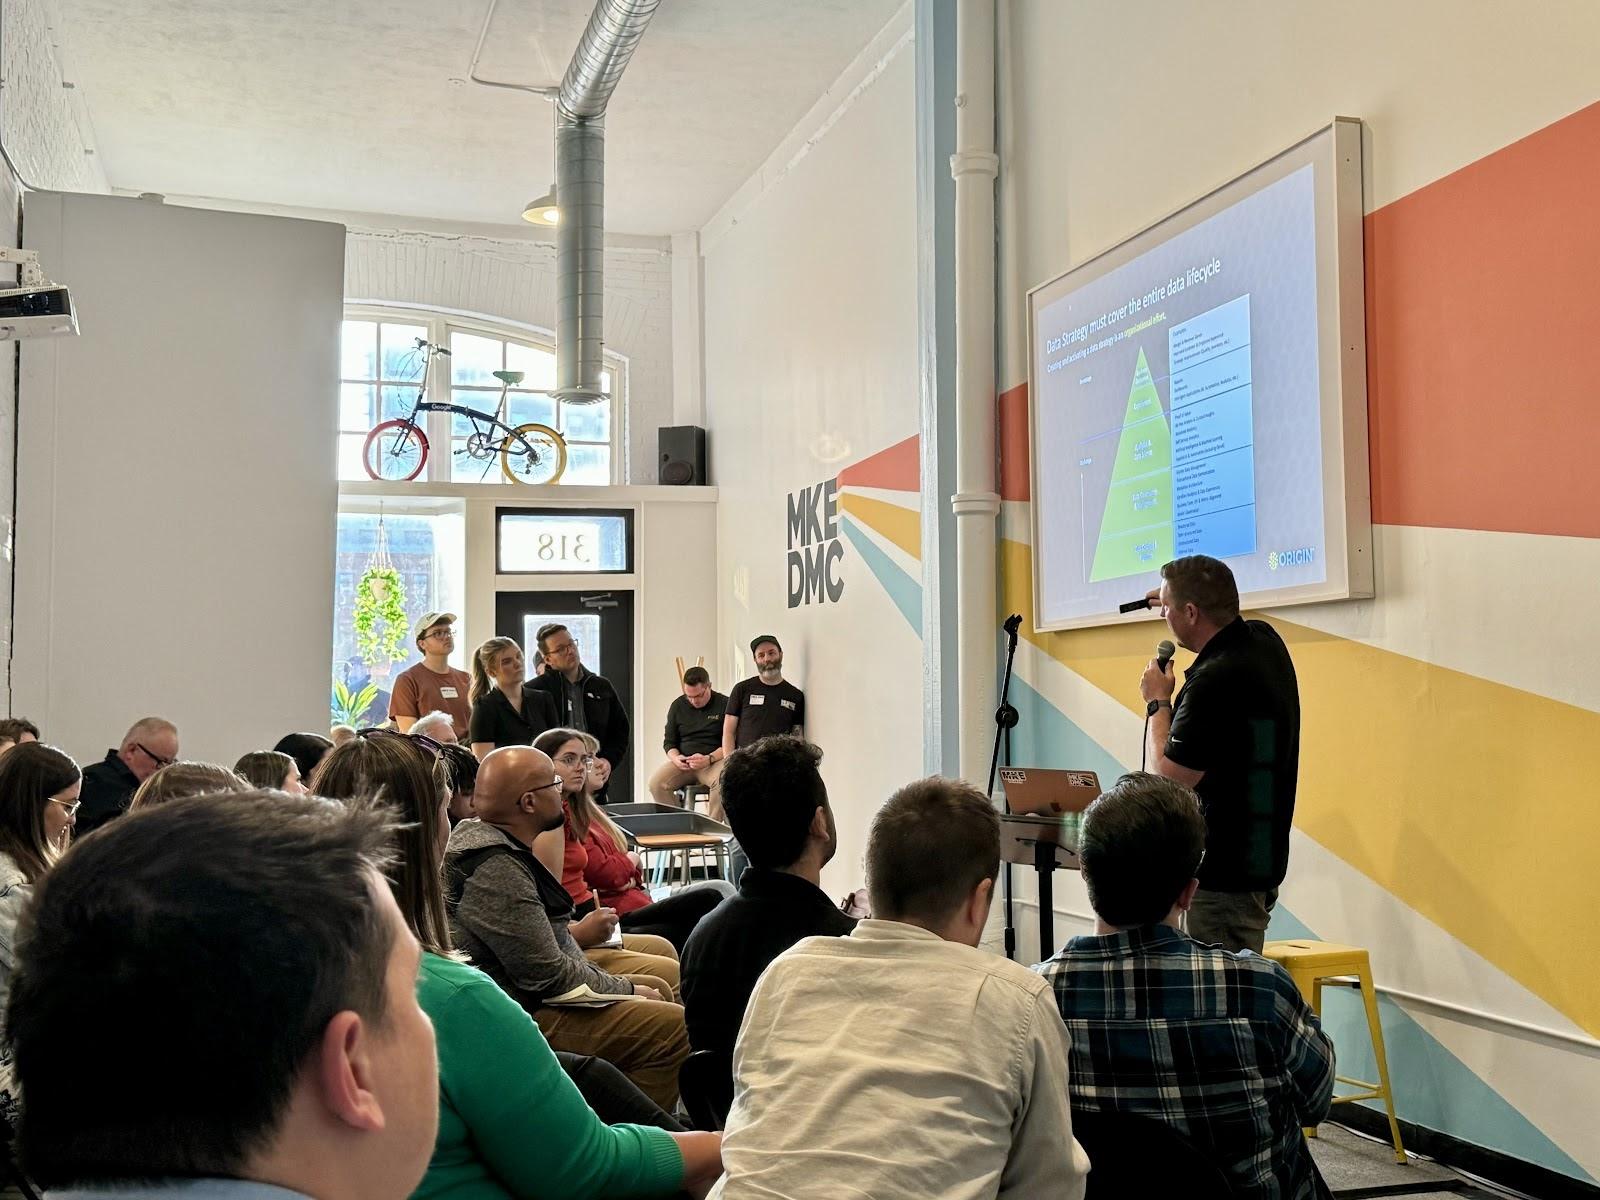
Nick White starts by getting straight to the heart of functional data management:
"How does your organization treat data?"

Why listen to Nick White?
Nick is a top strategy voice on LinkedIn, former Data Governance Director at Nike, Head of Data Strategy at Kin + Carta, and now a founding member and Head of Decision Science & Experience at Origin.
If you only have 3 minutes
Nick shared a lot of insights, and it’s definitely worth taking them all in - but if now’s not a good time for a thoughtful read, absorb these distilled takeaways:
Data strategy can be manageable if approached in small, actionable chunks. Knowing how to leverage data is more important than collecting all the data possible. Don't overthink data strategy—take action. Any organization can make better decisions with their data by starting small, for example: calculating the conversion rate from project work to monthly recurring revenue to determine lifetime value.
Takeaway: Start by identifying a small data project that can answer a question you can’t answer right now.
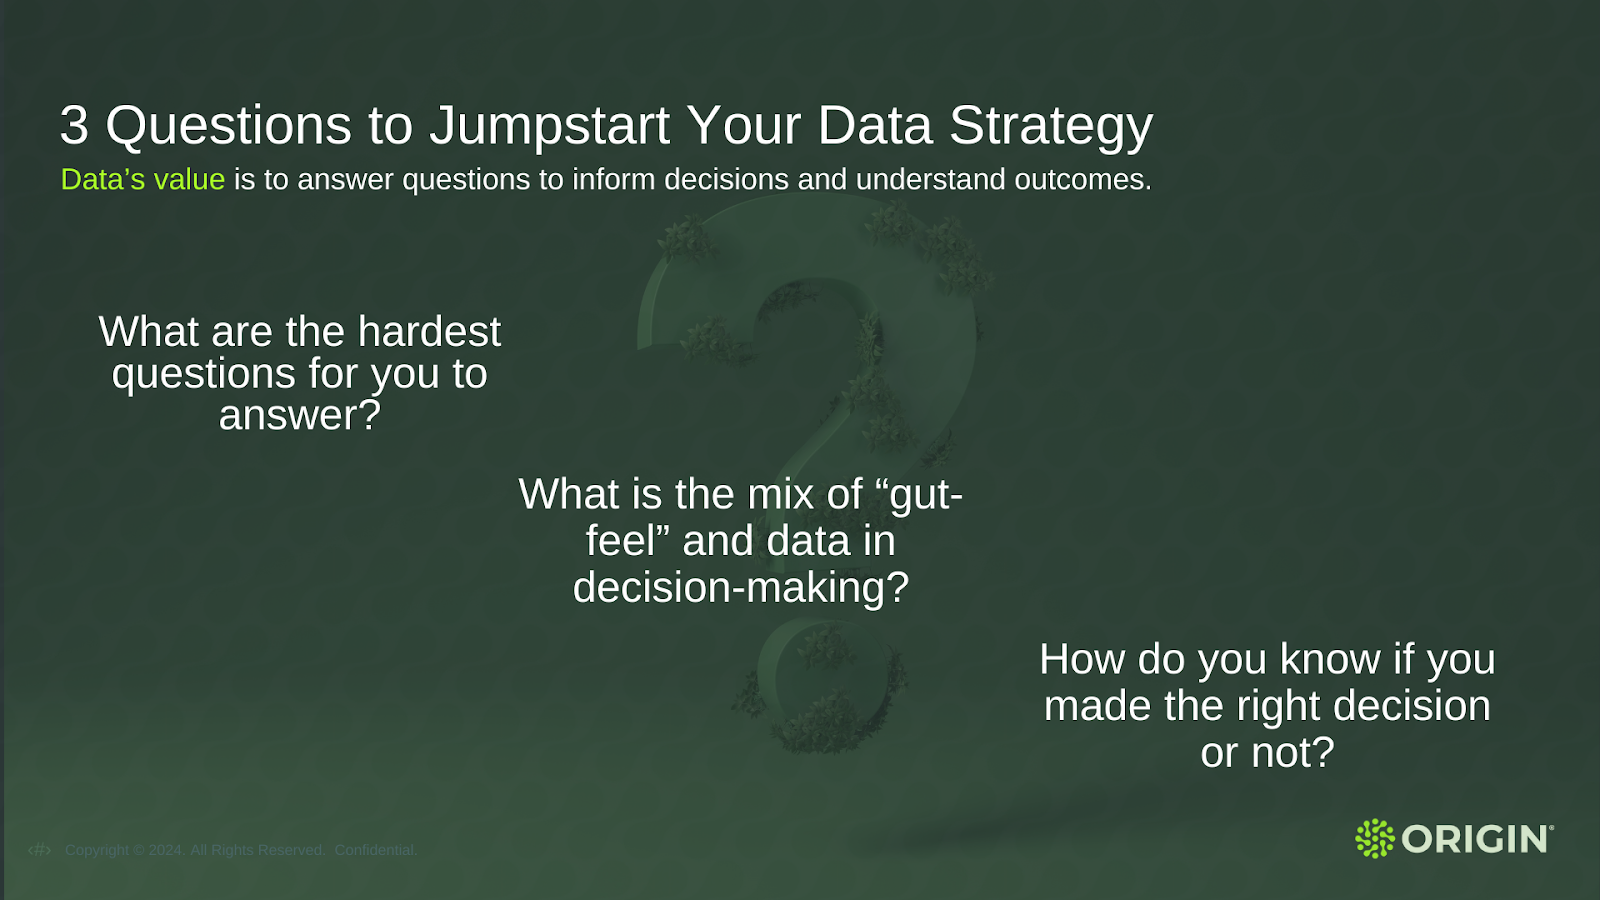
You can get meaningful answers without complex dashboards. Start with simple questions like: "What percentage of project customers convert to monthly recurring revenue?" Drilling down to a single specific question can provide significant insights, even with unstructured or extensive data. Experienced-based intuition is a type of data you can support with actual data analysis. Encourage people to validate their instincts with data.
Takeaway: Use straightforward questions to guide your data analysis. This helps in making data actionable without overwhelming dashboards.
- What happened?
- Why did it happen?
- What are we going to do as a result of it happening?
- How will we know if our response is successful?
Nick says, data is an asset.
In a lot of ways data is more like the renewable, natural and valuable energy sources that organizations are not putting the work into. So, should data be seen as wind or sun? Something you have already that can be a tremendous source of energy for your company or business objectives.
Being "data-driven" is rare. Only a small percentage of companies really pull it off or even know how to. Data-rich ≠ data-driven. Most organizations are data-rich, swimming in seas of data without a clear way to use it. Then there's "data-informed," a term I’ve been using for a couple of years because I thought it was a clever way to acknowledge how impossible data-driven feels.
Takeaway: Focus on the opportunity for data to drive decisions and achieve business outcomes, rather than just collecting data.
- Brainstorm what types of data you have. (Read the whole article to get ideas).
- How can this data help to drive a business outcome?
- Will you be consistent in governing it?
Don’t forget to bookmark or email yourself this page - you don’t want to miss out on all the insights and examples Nick shared in his presentation!

Data Culture & Mindset
Functional data management begins by answering this question: How does your organization treat data?
Nick categorized the typical approaches organizations take toward data management:
- Like a Product: Cross-functional teams create iterative data products within business capabilities.
- Like a Project: Data initiatives are handled as separate projects. Teams move from one task to the next without integration.
- Like an Input: Data is seen as an afterthought—merely an input to other digital products.
We learned: Most organizations fall short in their data strategy because they treat data as an isolated element rather than integrating it into a broader strategic framework. Viewing data as a critical component of the business is essential for driving value and achieving strategic goals.
"Nobody does this, and something like this thing, it's going to require effort."
Say it: This is hard, and that’s okay.
Takeaway: Consider how your business/agency currently uses data. You’re probably able to integrate data management as part of a broader strategy to add real value and drive outcomes. Keep a notepad visible on your desktop.
What Is Data Strategy?
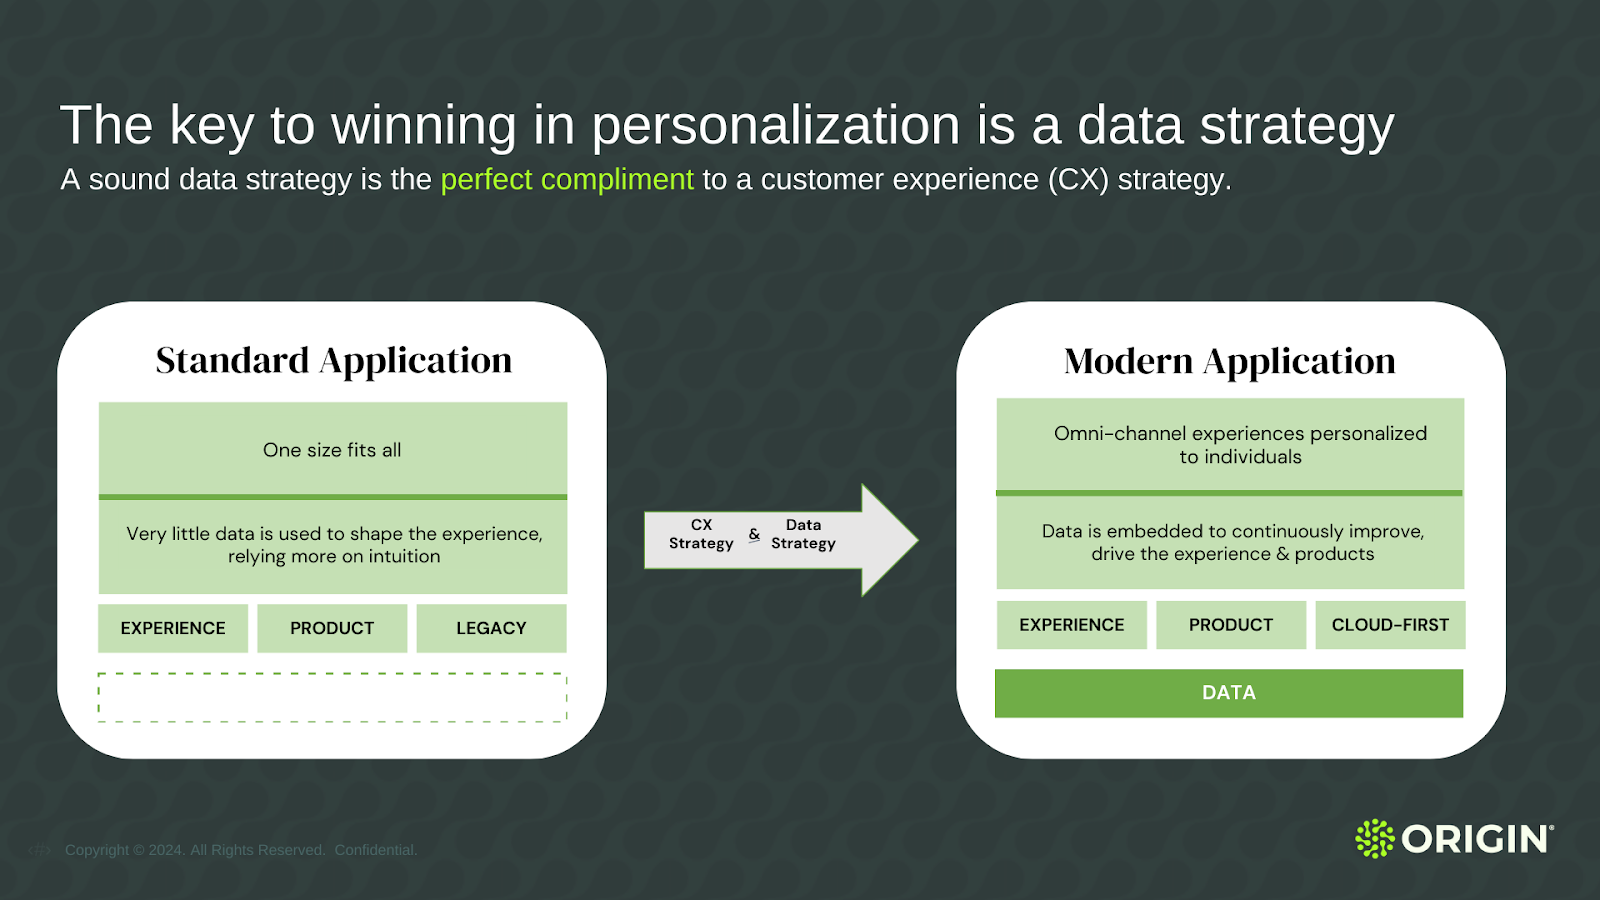
Data strategy is a plan that outlines how an organization will use data to achieve its business goals.
Data strategy covers the entire data lifecycle, from collection and storage to analysis and usage. A well-defined data strategy ensures that data is effectively managed, governed and utilized to drive business value.
"A data strategy needs to have a steel thread throughout the entire lifecycle."
Takeaway: How will you ensure data is well-managed from collection to analysis?
Companies need a cohesive approach that integrates every aspect of data handling within the organization.
Key Components of a Data Strategy
- Data Collection: Identifying internal and external data sources and establishing methods for collecting accurate and relevant data.
- Data Storage: Determining how and where data will be stored, ensuring scalability, security, and compliance with regulations.
- Data Governance: Implementing policies and procedures to manage data quality, privacy, and security. This includes defining roles and responsibilities for data stewardship.
"Clear definitions lead to consistent and trusted data fit for purpose."
Takeaway: Establish clear data governance policies to ensure data quality, privacy, and security in your agency.
- Data Integration: Ensuring data from various sources can be combined and analyzed to provide a comprehensive view of the business.
- Data Analysis: Using advanced analytics, machine learning, and AI to derive insights from data and support decision-making.
"AI is transforming how we approach data, but it should be seen as a tool to augment human efforts, not replace them."
- Data Utilization: Making data accessible to stakeholders across the organization to inform strategy, improve operations, and drive innovation.
"Data for data's sake does not add value."
- Data Management: Continuously monitoring and managing data assets to maintain their quality and relevance over time.
A successful data strategy aligns with the organization's goals and objectives, enabling improved performance, reduced costs, and a competitive advantage.
"Most organizations are failing to maximize data value due to lack of access, consistency, and trust."
You need to address challenges to fully leverage the value of data.
Nick's Top 3 Lessons About Data
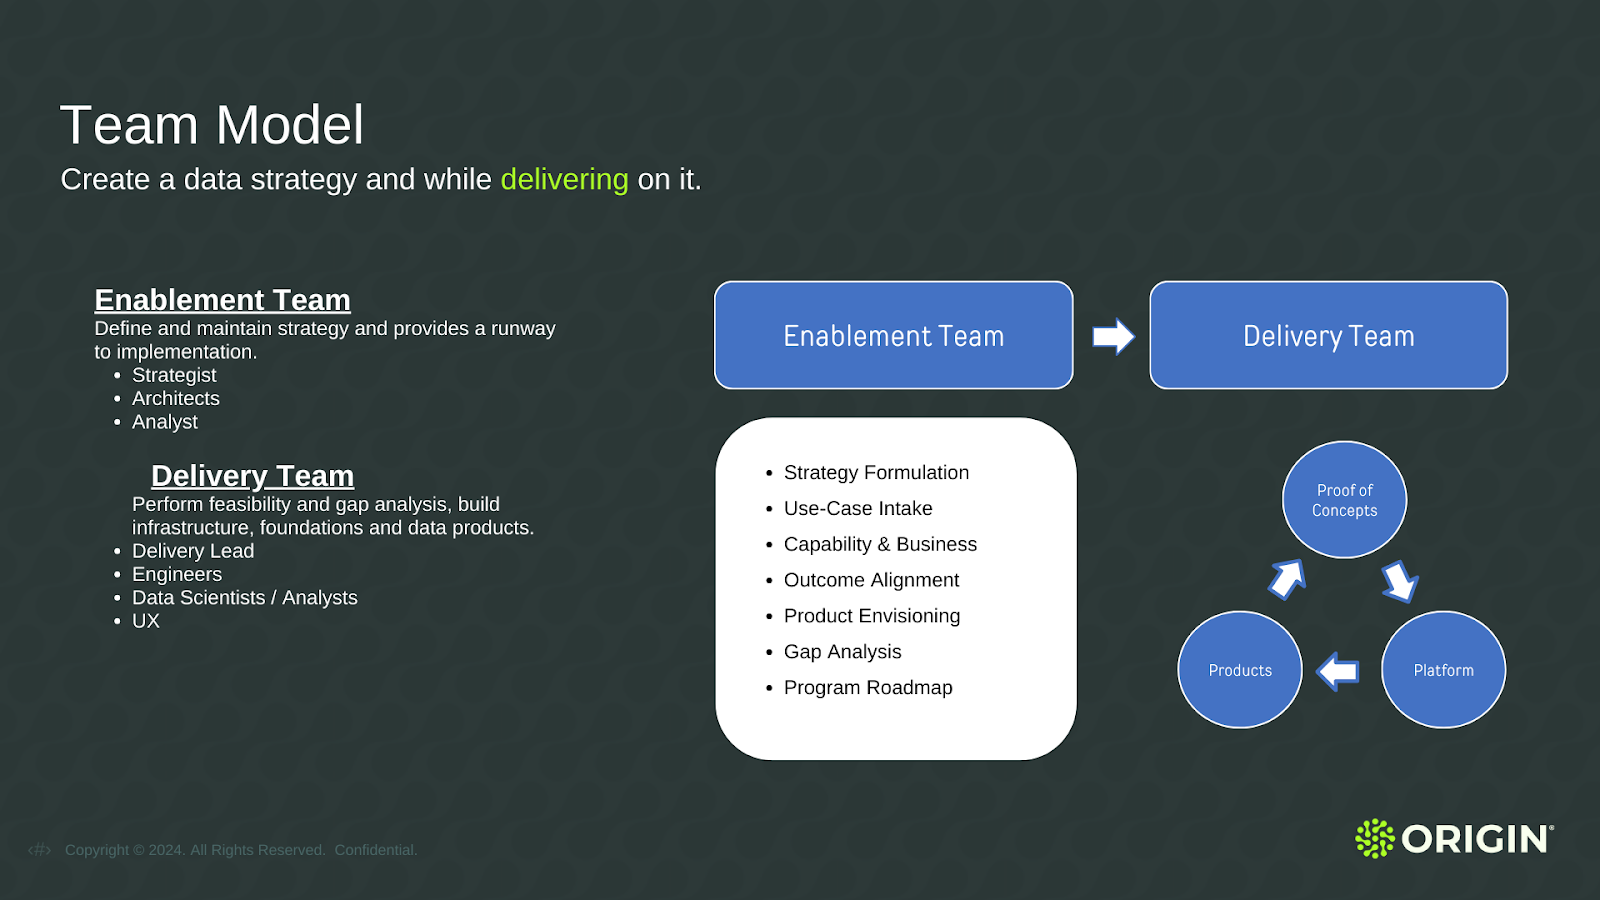
Coordinate People, Process & Technology
"It's cliché, but getting value out of data requires the coordination of people, process, and technology. In that order."
Takeaway: Coordinate your team, processes, and technology to effectively leverage data.
Organizational effort is necessary to leverage data effectively. It’s not just a technical challenge.
Focus on Outcomes, Not Outputs
"Data for data's sake does not add any value. Too many times people focus on operationalizing data instead of using data to increase revenue, decrease costs, and be strategically positioned."
Takeaway: Use data to achieve business goals. Simply imposing a data strategy does not add value. Map it to outcomes.
Maximize Data Value
"Lack of the right access, lack of consistency, lack of trust—most organizations are failing to maximize data value."
Most organizations fall short by failing to address these challenges. Focus on improving access, consistency, and trust in data to fully maximize its value.
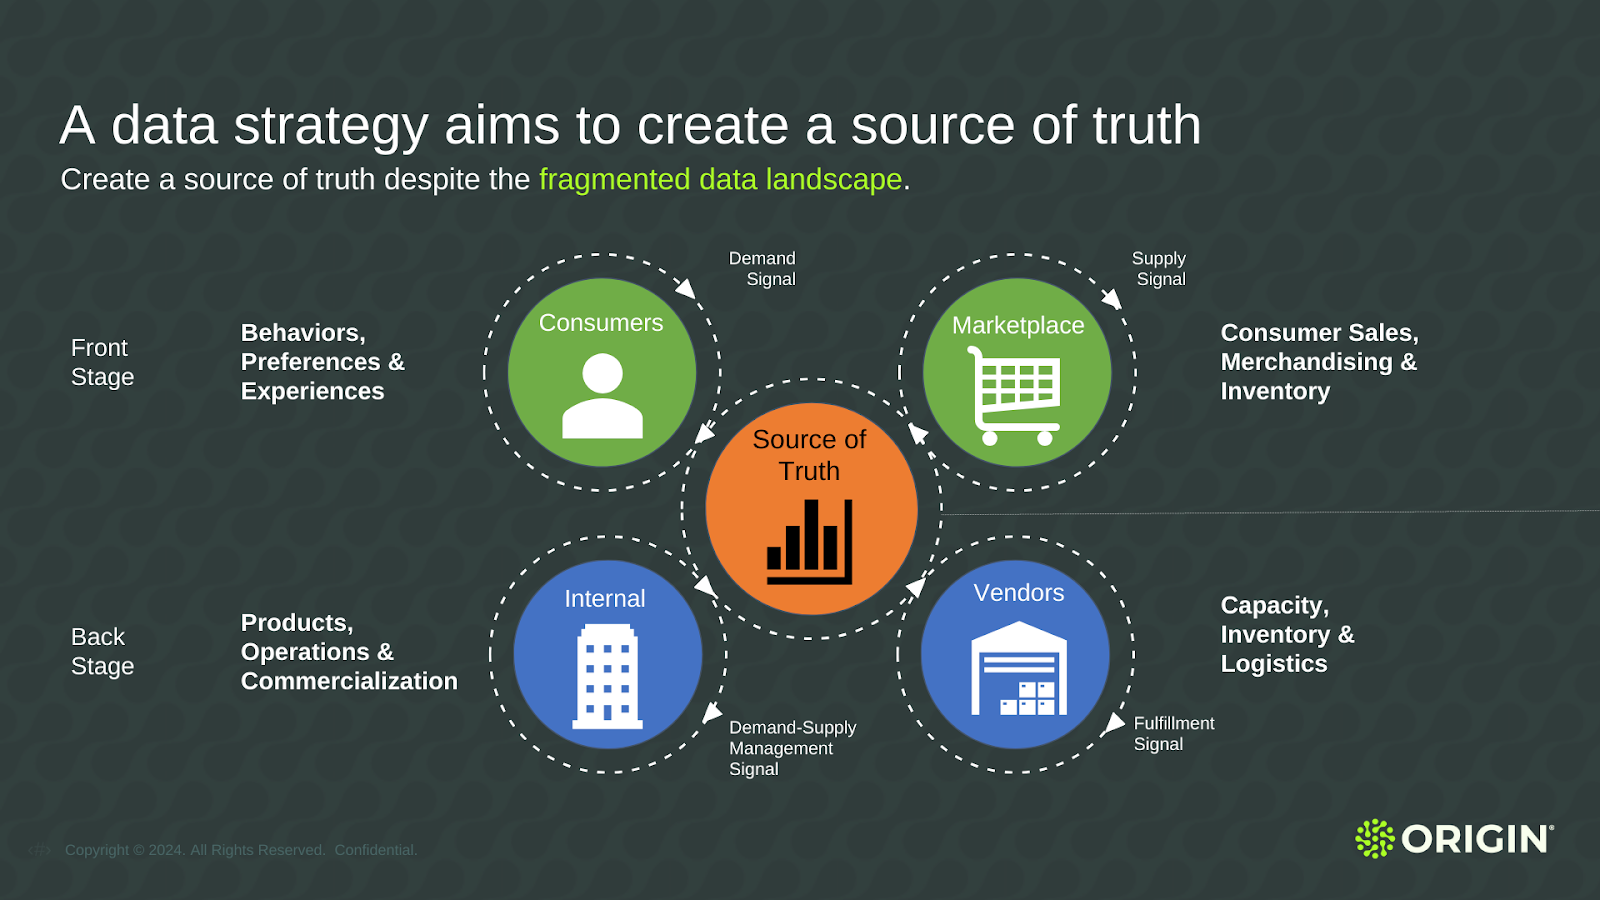
Covering the Entire Data Lifecycle
The necessity of a comprehensive data strategy that covers the entire data lifecycle cannot be overstated. The concept of "frontstage" and "backstage" illustrates this approach.
In the frontstage, where users interact, the focus is on business outcomes and user experiences. This includes:
- Creating margin & revenue gains
- Improving customer & employee experiences
- Making strategic improvements
Reports, dashboards, AI and automation are key elements in the frontstage.
In the backstage, the emphasis is on the underlying processes that support these outcomes. This includes:
- Data creation & ingestion
- Data governance & management
- Analytics & data science
Each of these backstage components must be robust to ensure the frontstage functions effectively.
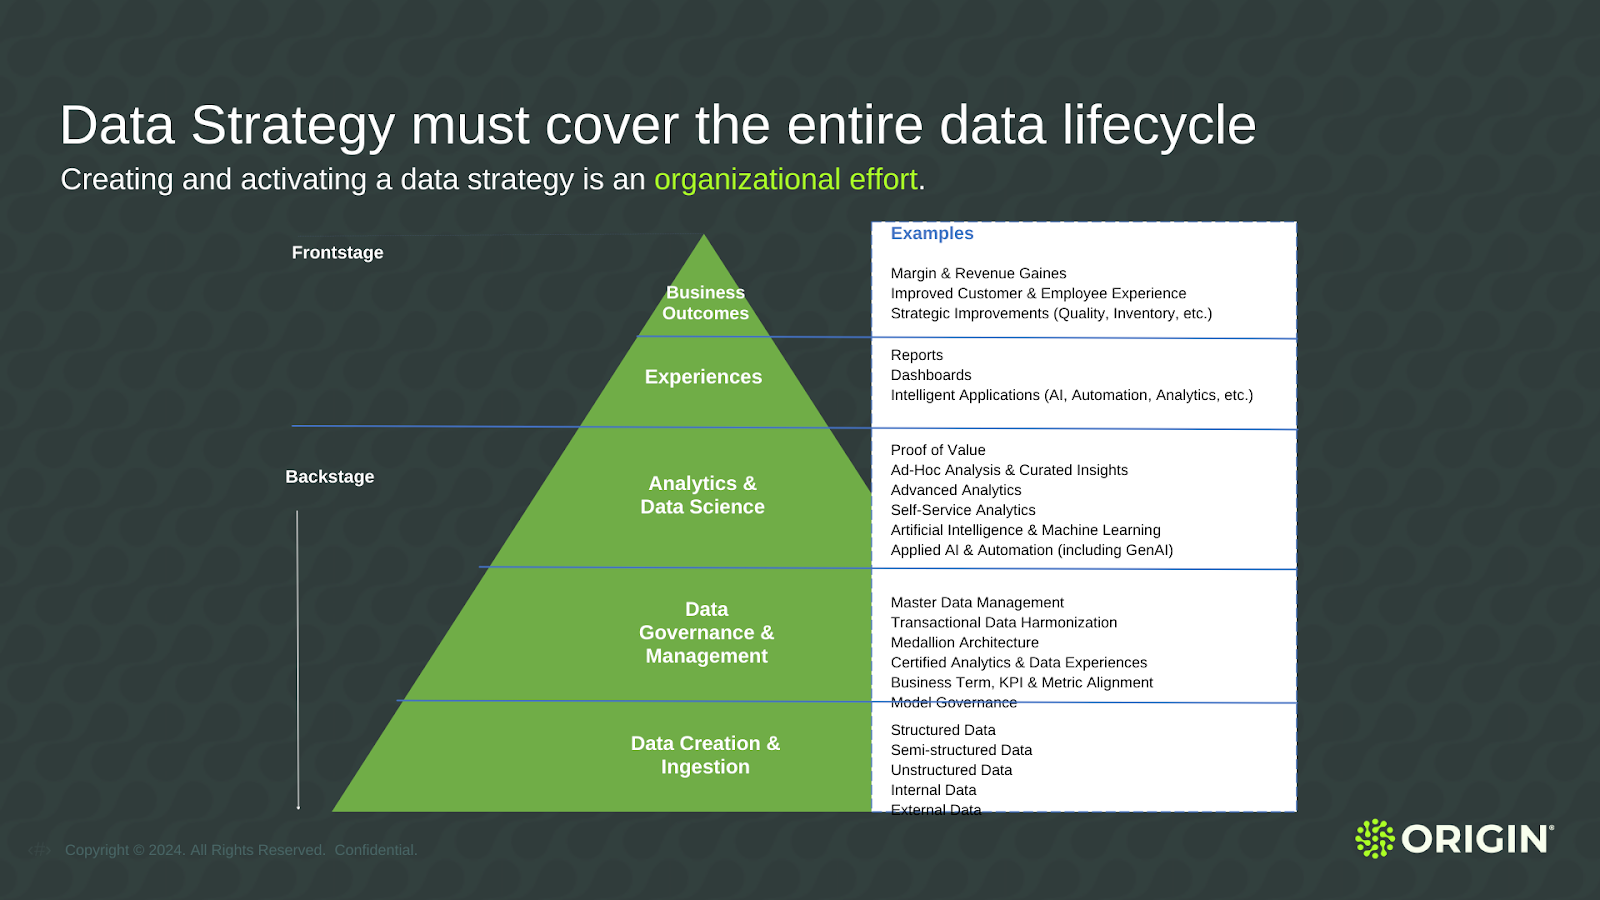
Starting with frontstage at the top and working down to the backstage allows the top to define the approach. By separating the frontstage and backstage, organizations can ensure that both user-facing and internal processes are optimized.
"If we're not building the frontstage right, it doesn't make a lot of sense."
Nick used the metaphor of constructing a bridge while walking over it to describe the challenge of creating a solid tech foundation while continuously driving business value.
Takeaway: Data initiatives must align with revenue goals and strategic objectives, even as the organization scales and adapts. Know and communicate goals and objectives across departments.
Say it: This is hard, and that’s okay.
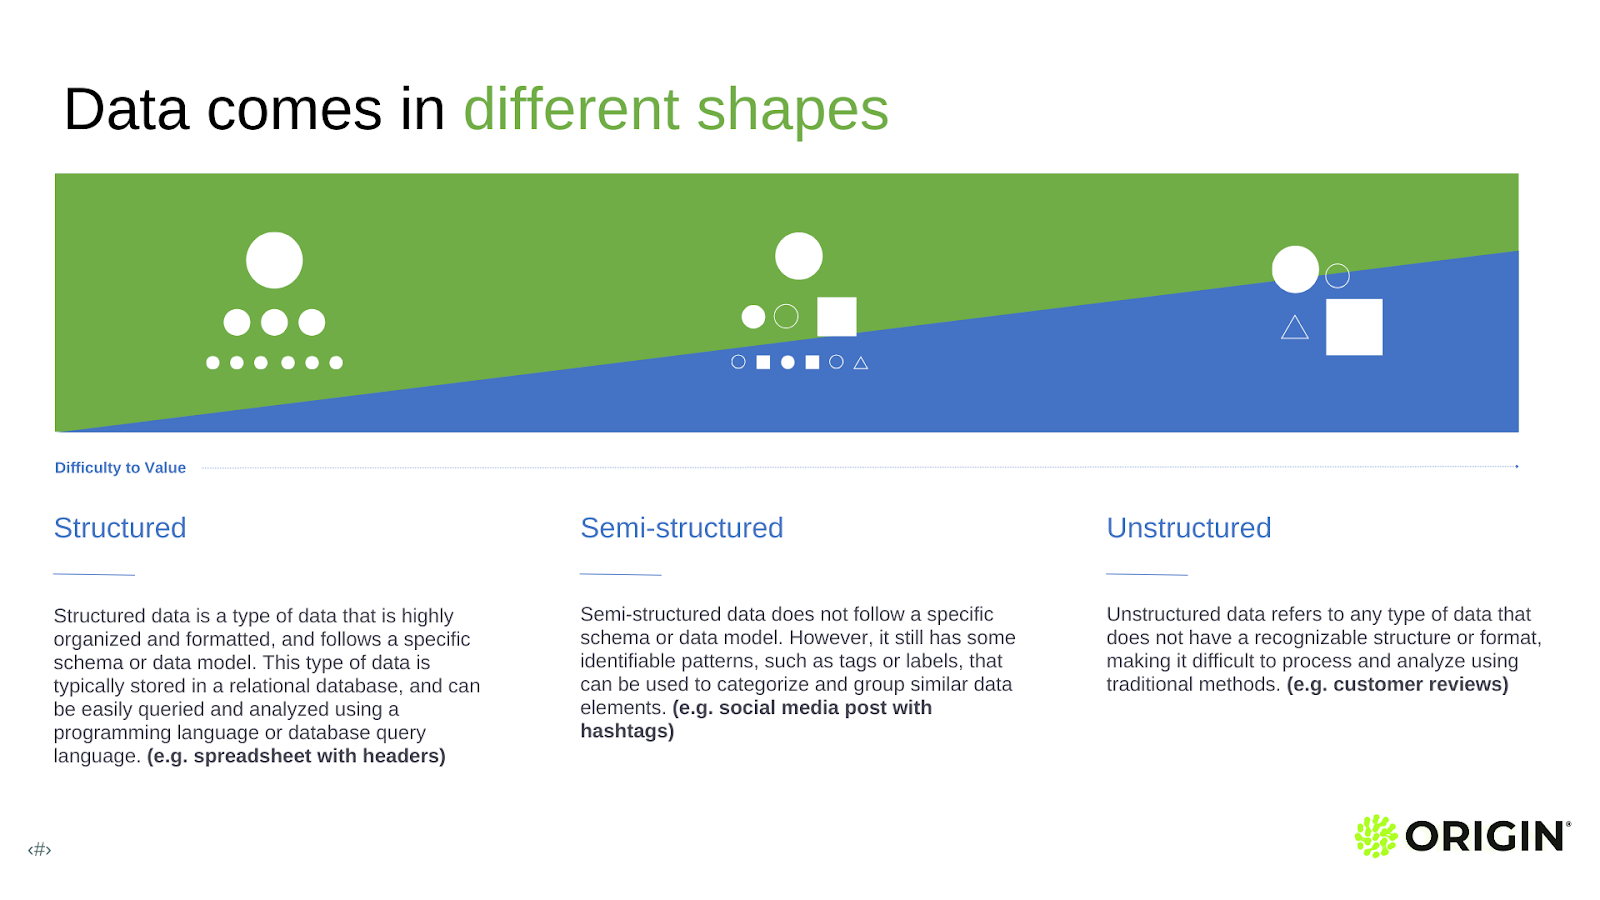
Data Comes in Different Shapes
- Structured Data: This data is highly organized and easily searchable, typically stored in databases like Excel spreadsheets. It's the easiest to get value out of due to its ordered nature.
- Semi-Structured Data: This includes data that isn't stored in a traditional database but still has some organizational properties, like hashtags used in social media. It's more challenging to work with than structured data but still manageable.
- Unstructured Data: This encompasses everything from text documents to multimedia content. Unstructured data is the hardest to work with but is becoming increasingly important as we use AI and machine learning applications.
"Content, documents, it's a form of unstructured data."
"The nice thing about the world is that you can put all of these in one place and do something with them."
Takeaway: Integration is key to making the most of your data, regardless of its structure.
Say it: This is hard, and that’s okay. Most of us are just learning about the differences between these data types and how to handle them. But it’s the first step toward effective data management!
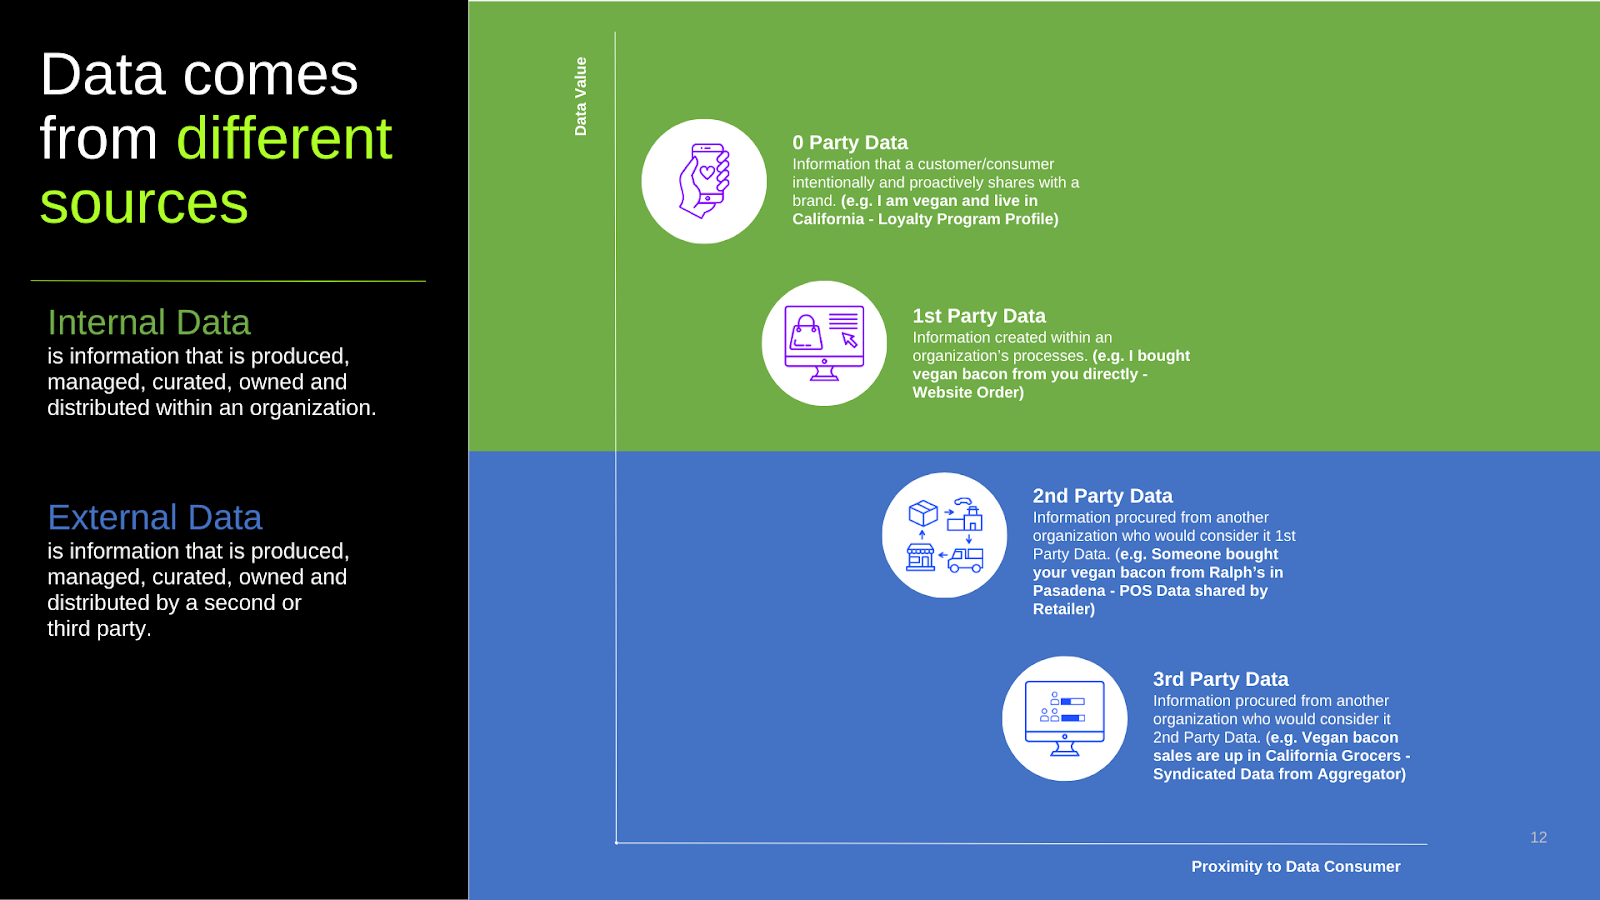
Data Comes from Different Sources
- Zero-Party Data: This is the data closest to the consumer, such as information they willingly share with you through a loyalty program. It's incredibly valuable for understanding your customers.
- First-Party Data: This includes internal data that your organization generates, such as sales data and operational data. It's data that you own and directly control.
- Second-Party Data: This type of data is obtained from partners or vendors. For example, KwikTrip (a Wisconsin staple) might sell you their data as a vendor. It's not direct, but still provides good contextualization.
- Third-Party Data: Aggregated data from external sources like surveys and market research firms. It gives a broader view but is generally less precise.
"Most of the biggest gains you can make is by triangulating all this data and really bringing it together to tell a true story."
But I'm a content person!
Love that. Here are two quick examples of why you might care:
- Knowing where your data comes from and how it can be used lets you develop a more effective content strategy. Structured data can help you identify trends and performance metrics, while unstructured data like user feedback and social media interactions provide deeper insights into audience behavior.
- Leveraging a mix of data types lets you make more informed decisions about what content to produce, when to publish it, and how to promote it. Easier decision-making improves business outcomes!

Data Comes in Pieces
Data is often scattered and comes in various forms, making it a challenge to integrate and make sense of. Nick simplifies things by breaking it down into different categories and explaining their roles.
Types of Data:
- Transactional Data: This type of data captures events that have occurred, such as sales transactions. A key question answered by transactional data is, "How did my product perform?" Depending on the organization's focus, this might be less about sales and more about operational efficiency, like improving the performance of a reusable rocket.
- Purchase Data: This type of data answers the question, "What am I buying?" It differs from sales data (what you sell) and focus on understanding the costs versus the prices of goods and services.
"Price is what I sell something to you for, cost is what I buy it for."
Takeaway: Differentiate between transactional and purchase data to understand both sales performance and cost management.
- Movement Data: This type of data tracks where products are, how they get there, and where they are going. It's crucial for logistics and supply chain management.
- Entity Data: This type of data includes information about people, places, and things. It answers questions about the who, where, and when. For example, location data was once a primary focus but has expanded to include detailed profiles of customers or consumers.
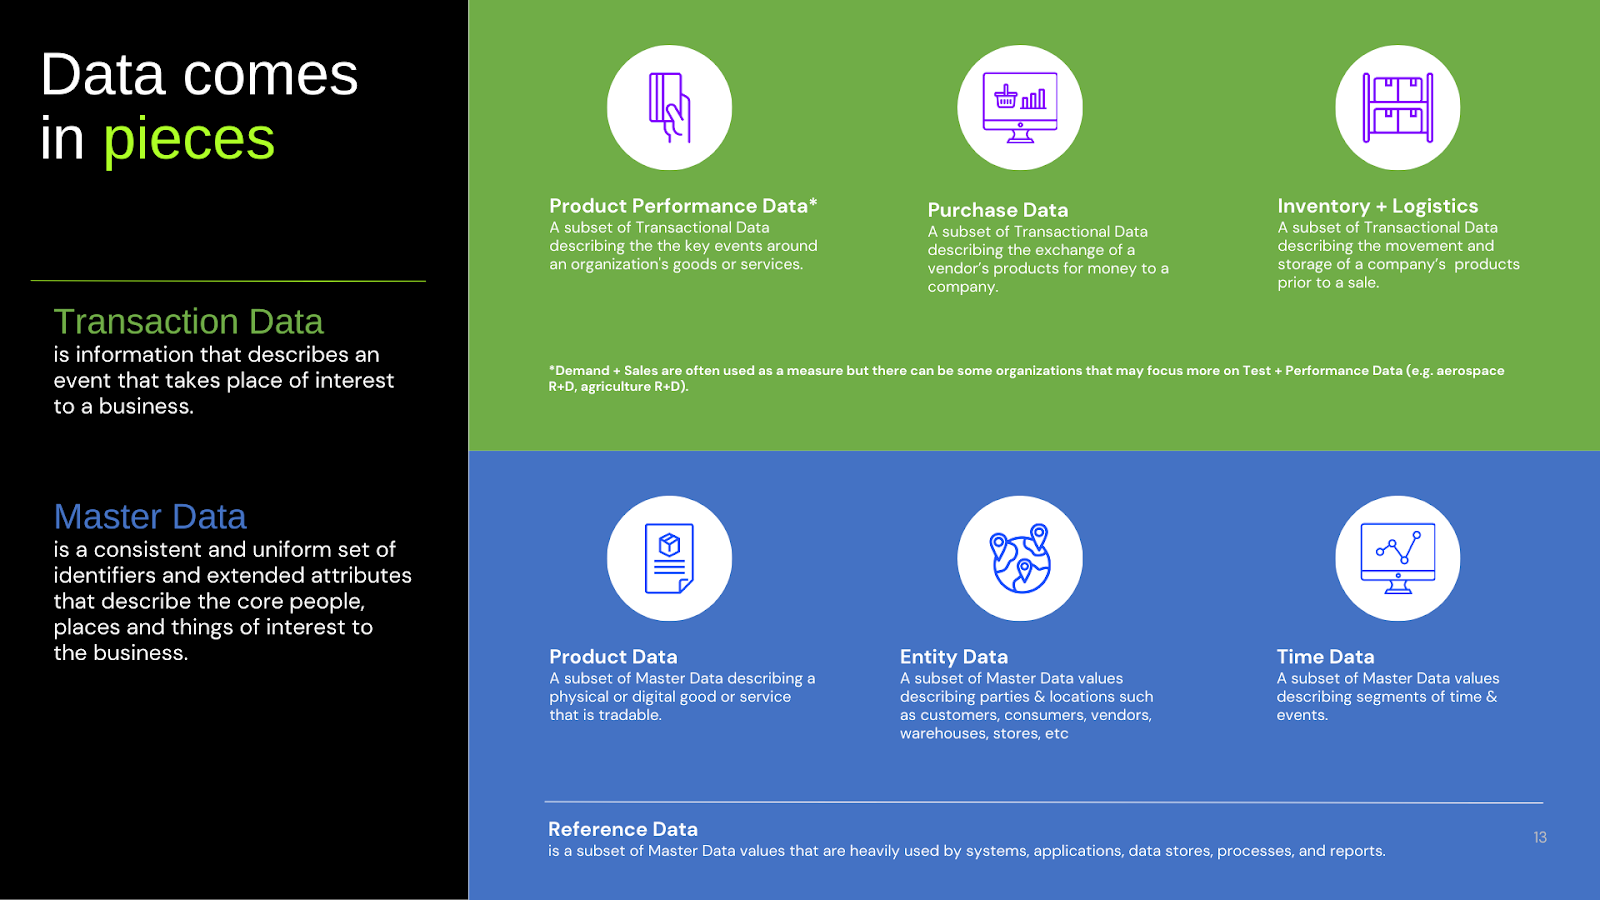
Nick also introduces the concept of reference data, which is highly used and standardized data that supports other data sets.
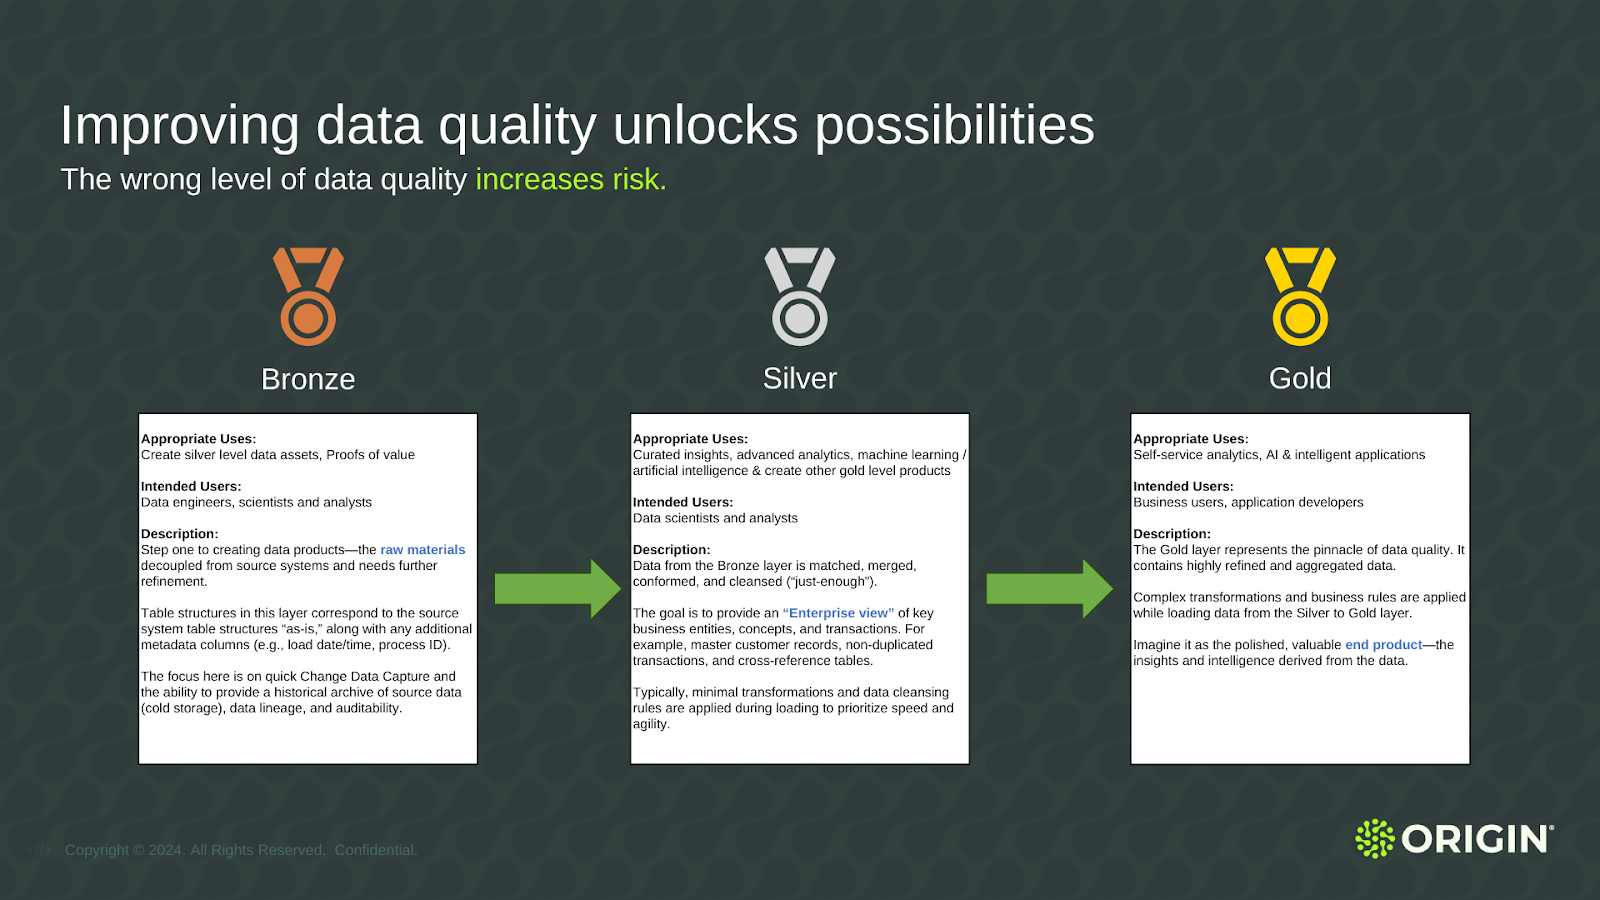
Medallion Architecture for Data
The medallion architecture is a way to measure data quality.
- Bronze: Raw, unprocessed data.
- Silver: Cleaned & enriched data that can be used for analysis.
- Gold: Fully processed, high-quality data ready for advanced analytics & AI applications.
Takeaway: Find some forgotten Bronze data. Use it to prove that data strategy can drive business outcomes, for example: meeting notes, time tracking sheets, or raw email data.
Here’s a quick case study to help you visualize: I used three years of Momentic time tracking data to identify trends.
Steps Taken:
- Gathered three years of time tracking data.
- Ensured data integrity by normalizing entries.
- Identified the most common tasks over the past three years.
- Compared the frequency and duration of tasks year-over-year.
- Analyzed if increased time spent on certain tasks correlated with improved project outcomes.
- Investigated the relationship between time allocation and client satisfaction (multiple ways to measure this).
Key Findings:
- More time spent on strategy and communication compared to three years ago.
- Led to better-aligned projects with client goals.
Improved Outcomes:
- Best client relationships and performance correlated with increased time on strategic and communication tasks.
- Demonstrated that strategic focus and rapport improved project outcomes.
Actionable Insights:
- Time-tracking data needs better governance at all levels for improved confidence.
- Invest in tools to enhance data accuracy and usability.
- Implement regular reviews to ensure data is being used effectively for decision-making.
- Evangelize data-driven insights to continuously improve processes and outcomes.
"Clear definitions lead to consistently trusted data that you know is fit for what you're doing for it."
Key Data Lifecycle Points:
- Understand Data Types: Recognize the different types of data (transactional, purchase, movement, entity) and their roles.
- Ensure Data Quality: Follow the medallion architecture to maintain high data quality. Clear definitions and governance are essential.
- Apply Integration & Context: Integrate various data types to gain a comprehensive understanding and context.
Improving Data Quality Unlocks Possibilities
Improving data quality is essential for unlocking its full potential. Nick highlights the value of using data to make informed decisions and the steps involved in this process.
Value Steps
Each step in this process adds value and helps collect the business context needed to ensure the data is good and valuable. Understanding these steps is crucial for developing a robust data strategy.
- Proof of Value: Start by using data to provide insights that demonstrate its value. Show users how insights can help them.
- Consistent Analysis: Move from ad hoc analysis to providing consistent insights. This involves refining the data and ensuring it is reliable.
- Advanced Analytics: Apply advanced analytics and machine learning to produce deeper insights. This goes beyond simple analysis to predictive and prescriptive analytics.
- Self-Service Analytics: Empower users to explore data and generate insights on their own. This democratizes data and fosters a data-driven culture.
- Automation & AI: Finally, integrate AI and automation to streamline processes and improve efficiency. This can include chatbots and other applications.
Takeaway: Follow this sequence to improve data quality.
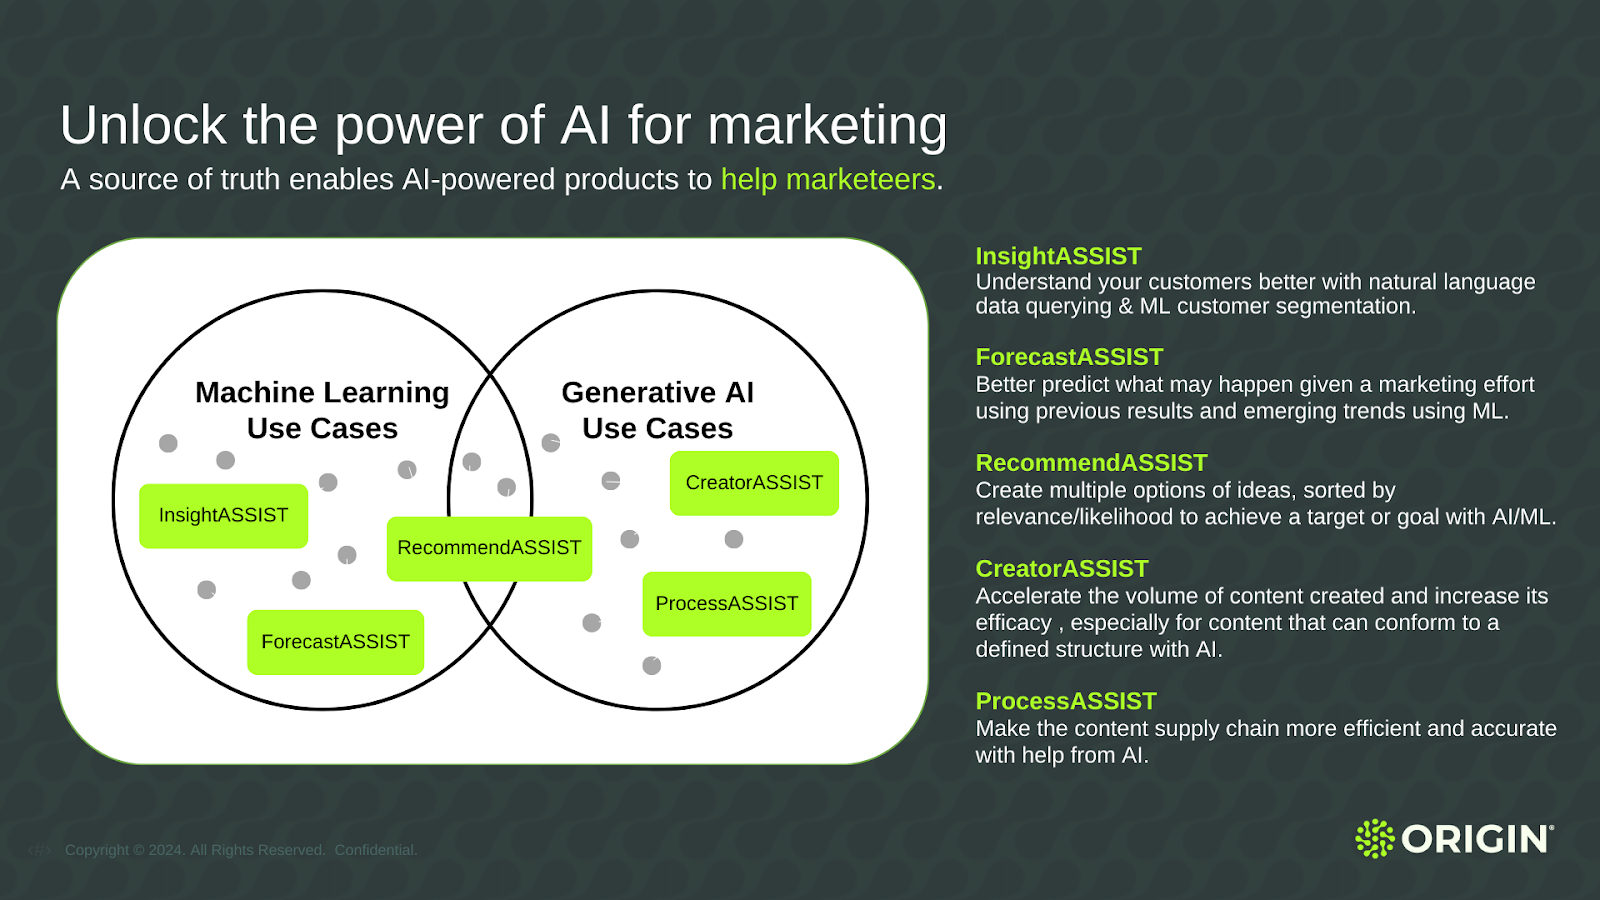
Realize Value with Data Experiences
There are three types of data experiences:
- Reports: Reports are static, time-bound documents that often end up on PowerPoint slides. While they provide valuable information, they are limited in interactivity.
- Dashboards: More dynamic than reports, dashboards are updated regularly and allow users to interact with the data. They enable slicing and dicing to derive insights and make informed decisions.
- Intelligent Applications: These applications use data to enhance the user experience with everyday tools and services. For example, Netflix uses data to change cover images and recommendations based on user preferences, to encourage more watching.
Real-Life Example of a Business Outcome
Nick e provided practical examples of how focusing on business outcomes rather than data outputs can drive meaningful change.
When working in a previous role, Nick shifted the focus from operationalizing data to using it to improve specific business metrics. Instead of just tracking full-price sales percentages, he encouraged demand planners to use forecasting tools to predict sales trends and adjust plans accordingly.
"All I did was get them to stop copy and pasting last season's demand plan and start using a percentage of how many more fleeces would sell in November than October."
This approach helps non-data people understand and act on data insights, making them more effective in their roles.
Takeaway: Focus on using data to achieve strategic goals, such as increasing revenue or reducing costs. Provide tools and insights that help users make better decisions.
"Focus on using data to increase revenue, decrease costs, and be strategically positioned."
Data-Rich vs. Data-Driven Companies
"Most analog companies are data-rich but not data-driven."
Data-rich companies collect vast amounts of data but often fail to use it effectively. In contrast, data-driven companies leverage their data to inform decisions and drive business outcomes.
Tesla uses data to enhance product development and customer experience, unlike traditional companies that may have data but lack actionable insights.
Takeaway: Use the data you collect to inform decisions and drive desired outcomes.

Overcoming Resistance in Data Utilization
Overcoming resistance to data utilization requires storytelling and demonstrating value. Providing clear case studies and practical examples helps bridge the understanding gap.
"It's about explaining data's value in a way that resonates with stakeholders."
Takeaways: When facing resistance, focus on small wins and tangible results. This builds confidence and showcases the potential of data-driven decision-making. You goal is to gain broader acceptance over time. Try the following methods to overcome resistance:
- Provide practical examples to show the greener pastures
- Use storytelling to show what happens if you don’t
- Tell them your top competitor is doing it - never fails 🙂
Data Strategy for Small & Large Organizations
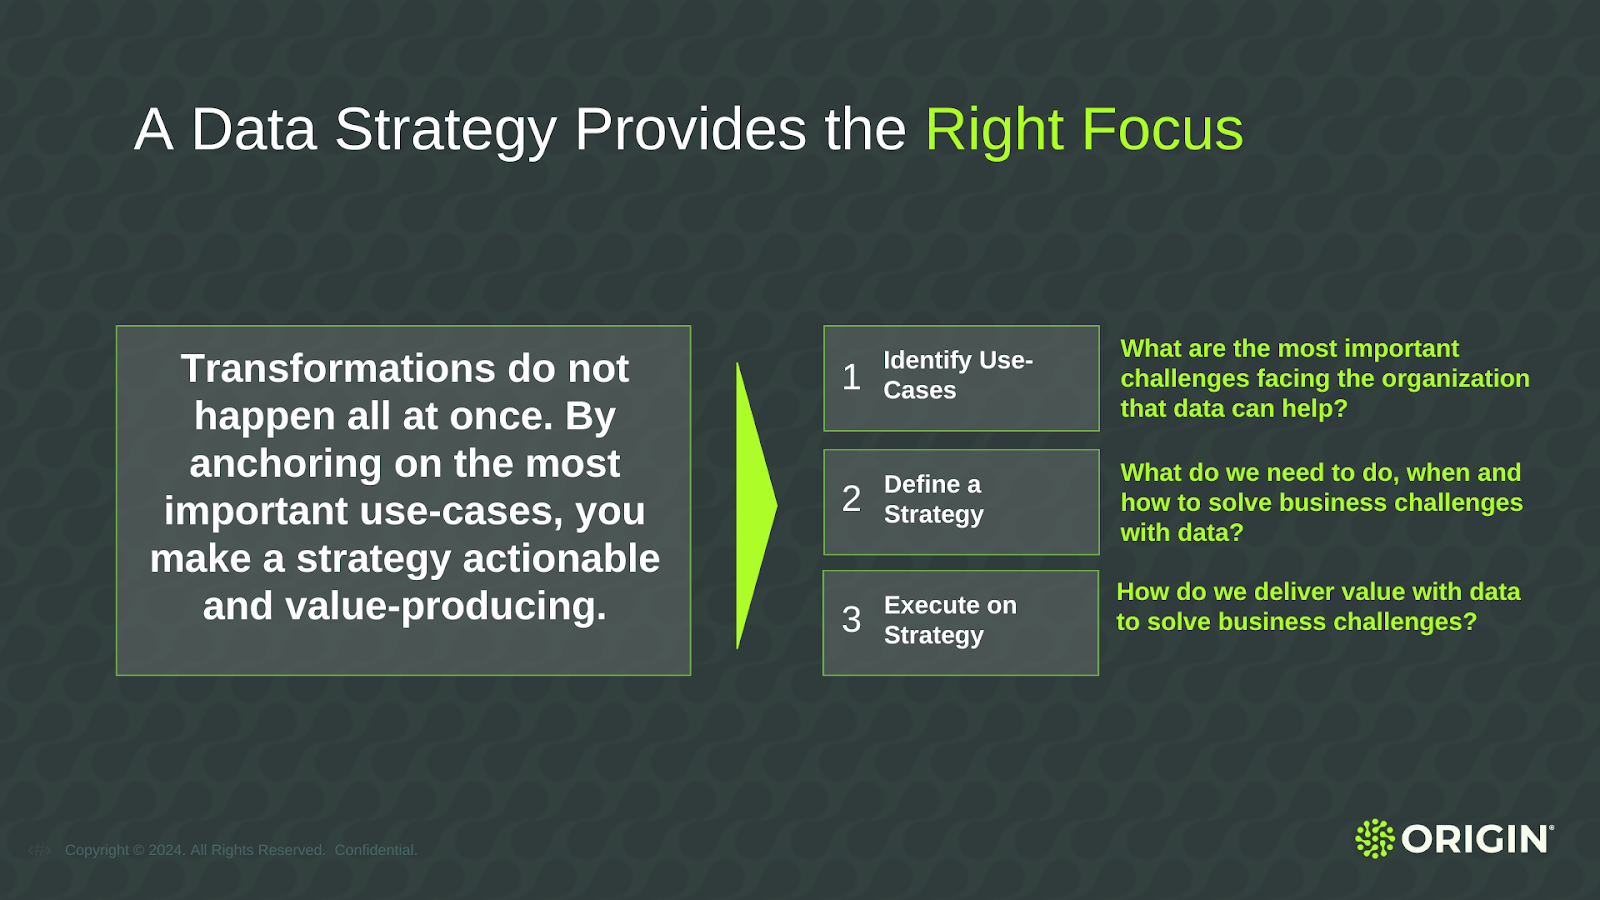
Data strategy isn't just for large organizations. Smaller companies can benefit by focusing on specific use cases that address immediate pain points. This approach allows for scalable solutions that grow with the organization.
"Think big, but start small."
Large companies, despite their resources, often struggle with foundational issues. Addressing these through targeted, iterative projects ensures sustainable progress and avoids the pitfalls of large-scale, unfocused initiatives.
Takeaways:
- Both small and large organizations can benefit from a focused approach to data strategy.
- Address specific use cases to start, and scale solutions over time.

Final Thoughts
This was our third event, and we’re so grateful that Nick White was with us to share his approach to data strategy for the AI era. His thoughts on how data can be used as a strategic asset and why it’s critical to develop a data strategy have impacted companies including Nike and Pepsi, yet they’re applicable to organizations of all sizes.
Special shoutout to:
- Ski Team Video Agency / Independent Studios US for sponsoring us this month
- The MKE DMC volunteer team
- McDill, Granular & Momentic
- Everyone who attended, and those who wanted to but couldn’t make it
We’re excited to continue to host speakers with a wide variety of digital marketing experiences as our community grows together!

About the author
.png)